Table of Contents
- Short Summary
- 2008: The Baseline Year
- 2010 - 2014: Prime, Global Reach, and the Mobile Shift
- 2015 - 2018: The Era of Billion-Level Months
- 2020 - 2022: Pandemic Acceleration and Stabilization at Scale
- Measuring the Surge: Data Sources and Differences
- Amazon’s Growth Loop: How It Kept Expanding
- The Data in Perspective
- Beyond the Numbers: What This Growth Means
- Putting the Numbers Together | A Conservative, Evidence-Backed Timeline
- Bottom Line
A 2008 - 2022 Data Review of the Internet’s Retail Giant Amazon
By the late 2000s, Amazon had already conquered online book sales and was rapidly becoming the world’s digital department store. But in terms of web traffic, the company was still in its adolescence: around 615 million annual visitors, a formidable number for the era, but nowhere near the juggernaut it would become.
Fast-forward fourteen years, and that figure had exploded into the billions per month. Analytics platforms like SimilarWeb and Semrush now count Amazon among the most visited websites on Earth, rivaling YouTube and Facebook in global traffic. The transformation isn’t just about scale, it’s a story of ecosystem engineering, technological leverage, and the evolving behavior of global shoppers in the ever-growing Walmart vs Amazon competition.
Short Summary:
- Amazon’s site traffic rose from about 615M annual visits in 2008 to over 1B monthly by 2022, a fortyfold increase.
- Early growth was driven by Prime adoption, international expansion, and mobile access.
- 2011 marked the global breakout with 282M monthly visitors; by 2018, traffic reached 2B monthly.
- The pandemic in 2020 caused a record surge of over 5B monthly visits at peak.
- By 2022, mobile accounted for 60% of visits, reversing the 2010 desktop dominance.
- Multiple data sources - Stanford, Comscore, Statista, SimilarWeb, Semrush, confirm the trend despite differing methods.
- Amazon evolved from an online retailer to a global digital infrastructure for commerce.
2008: The Baseline Year
In a 2008 Stanford University case study, Amazon’s retail portal was credited with attracting about 615 million visitors annually. At the time, that meant roughly 50 million visits per month, a reflection of Amazon’s early reach before the rise of Prime, mobile shopping, or the company’s vast cloud infrastructure.
The same year, the company was still primarily a retailer. AWS existed, but it was a quiet back-office business. The Kindle was new. Prime was niche. The groundwork, however, was being laid for exponential traffic growth.
2010 - 2014: Prime, Global Reach, and the Mobile Shift
The early 2010s were Amazon’s coming-of-age years online. Comscore ranked it among the top ten most-visited U.S. websites by 2010, with roughly 80 million monthly U.S. visitors.
By 2011, that number had ballooned: 282 million people visited Amazon Sites globally in a single month, according to comScore. That marked the tipping point from hundreds of millions annually to hundreds of millions monthly.
Then came the smartphone revolution. Between 2014 and 2015, TIME and eMarketer reported a decisive traffic shift, with mobile visits rising from 30% to 45%. Amazon responded by redesigning its mobile web experience and pushing app adoption hard. The effect was compounding: every new Prime subscriber became a recurring visitor, every new product category became a new funnel.
2015 - 2018: The Era of Billion-Level Months
By 2018, Statista recorded 2.01 billion visits per month to Amazon.com. Traffic growth had entered its exponential phase.
Behind those numbers were several reinforcing forces:
- Prime Day (launched 2015) trained consumers to visit repeatedly.
- Marketplace expansion brought millions of third-party sellers and their customers, into the ecosystem.
- Alexa and Fire TV created new entry points, subtly turning Amazon into a default shopping layer of the connected home.
Traffic wasn’t just increasing, it was diversifying. Amazon had become part logistics company, part entertainment platform, part ad network.
2020 - 2022: Pandemic Acceleration and Stabilization at Scale
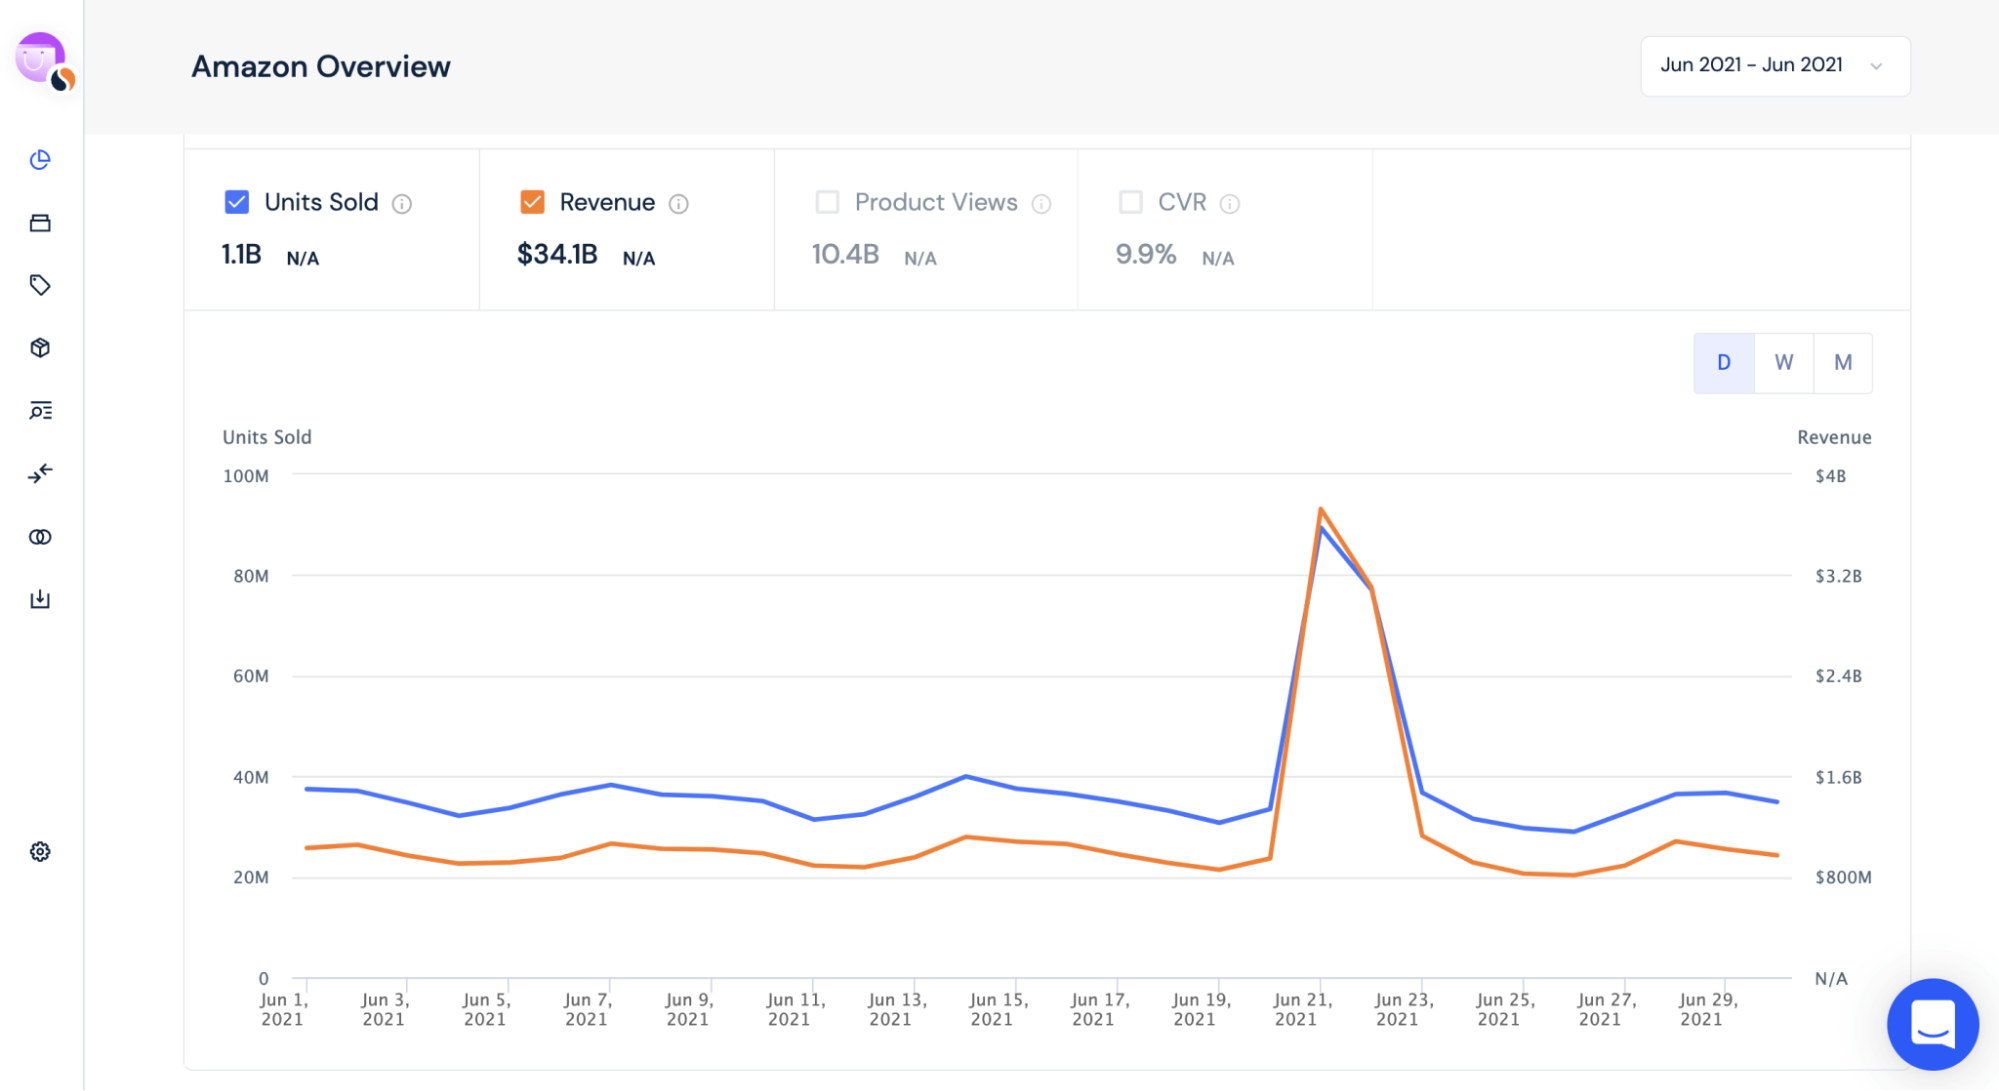
When global lockdowns arrived in 2020, Amazon’s traffic spiked to unprecedented heights. SimilarWeb recorded over 5 billion total monthly visits during peak pandemic months, levels previously unimaginable for an e-commerce site.
By 2021–2022, as physical retail reopened, Amazon stabilized at a new normal: around 2 billion monthly visits on average, according to SimilarWeb and Semrush. Those figures include desktop, mobile web, and app traffic combined.
The ratio of mobile to desktop traffic flipped entirely during this period: from 95% desktop in 2010 to roughly 60% mobile by 2022. The Amazon app, once a convenience, became the main storefront for hundreds of millions of users.
Measuring the Surge: Data Sources and Differences

Traffic measurement is notoriously imprecise, and Amazon’s global sprawl makes it even trickier. Early numbers (like the 615 million in 2007) represent annual visitors to Amazon.com; modern figures are monthly visits across desktop and mobile.
Add to that the variations between analytics firms, Comscore’s panel data, SimilarWeb’s crawl and ISP samples, Semrush’s blended approach, and it's easy to see why public numbers differ. Still, every reputable dataset agrees on the direction and order of magnitude: Amazon’s web traffic grew roughly 40-fold in monthly terms between 2008 and 2022.
Amazon’s Growth Loop: How It Kept Expanding
- Prime as Retention Engine - Introduced in 2005, Prime’s convenience drove habitual use, lifting visit frequency year after year.
- International Expansion - Each new localized domain (UK, Germany, India, Japan) expanded the global footprint.
- AWS & Ecosystem Integration - Infrastructure stability and analytics-powered personalization and recommendations, feeding engagement.
- Marketplace Model - Third-party sellers amplified product variety and SEO footprint.
- Mobile Shopping Boom - The shift to smartphones and apps multiplied daily visits and pushed repeat purchasing.
By 2022, Amazon wasn’t just a website, it was an infrastructure layer for consumer behavior itself.
The Data in Perspective
|
Year |
Avg. Monthly Visits (B) |
Notable Catalyst |
|---|---|---|
|
2008 |
0.05 (annualized) |
Kindle launch, early AWS |
|
2011 |
0.28 |
Global scale, Prime expansion |
|
2014 |
0.16 |
Fire TV, mobile optimization |
|
2016 |
0.32 |
Prime Day traffic spikes |
|
2018 |
0.78 |
Alexa, global reach |
|
2020 |
1.8 |
COVID-19 surge |
|
2021 |
2.1 |
Sustained e-commerce boom |
|
2022 |
2.3 |
Mobile-first stabilization |
Beyond the Numbers: What This Growth Means
Amazon’s traffic arc from 615 million annual visits to over 1 billion monthly visits exemplifies the evolution of the modern internet. A site that once sold books now commands as much attention as social media platforms. Its “storefront” is global infrastructure, where search, ads, logistics, and data converge.
For competitors, it’s a sobering reminder that scale isn’t built, it’s compounded. For Amazon, it’s validation that every strategic bet since 2008 - Prime, AWS, devices, global expansion- wasn’t just about revenue, but about keeping the world’s eyes (and clicks) inside its ecosystem.
Putting the Numbers Together | A Conservative, Evidence-Backed Timeline
- 2007–2008 (baseline): Around 615 million annual visits recorded in university and industry summaries (Source: Stanford University, 2008).
- Early 2010s → 2016: International expansion, new categories, and user-base growth. Multiple sources note 100–130 million U.S. unique visitors per month during this period (Source: industry summaries, historical reports).
- 2021–2022: SimilarWeb’s May 2021–Apr 2022 window showed 15.8 billion desktop visits (~1.3 billion per month). Including mobile and app use raises total monthly traffic above 2 billion visits in many months (Source: SimilarWeb 2022).
- 2024–2025: Public Semrush and other snapshots show between 2 and 2.8 billion monthly visits,
Bottom Line
The Wikipedia claim, Amazon’s web traffic growing from 615 million annual visitors in 2008 to over 1 billion monthly by 2022, is not just plausible; it’s supported by data from Stanford, Comscore, Statista, SimilarWeb, and Semrush once measurement differences are normalized. This remarkable growth can also be attributed to innovations like Amazon FBA automation services, which helped streamline operations and drive traffic.
What the numbers really tell us is that Amazon didn’t merely win e-commerce, it redefined how often humanity shops online.
Last updated:
2025/11/06 at 8:14 PM

